line chart with date on x axis
- Daniel
- Offline
- Administrator
-

06 Oct 2017 05:52 #4927
by Daniel
Thanks
Daniel
Replied by Daniel on topic line chart with date on x axis
Hi,
Are you trying to edit the data values available in Database before plotting these on the Chart?
Are you trying to edit the data values available in Database before plotting these on the Chart?
Thanks
Daniel
Please Log in to join the conversation.
- Peter Scal
- Topic Author
- Offline
- New Member
-

Less
More
- Posts: 2
05 Oct 2017 19:08 #4926
by Peter Scal
Replied by Peter Scal on topic line chart with date on x axis
ok, i've been working on this but still no resolution.
I think the issue is that i'm creating the data using Fabrik, which puts the value label in the database table, and to get the the raw numeric value i need to add _raw to the data element but vChart dropdown doesn't show that element and I can't edit it.
I'll send the login as you suggested.
peter
I think the issue is that i'm creating the data using Fabrik, which puts the value label in the database table, and to get the the raw numeric value i need to add _raw to the data element but vChart dropdown doesn't show that element and I can't edit it.
I'll send the login as you suggested.
peter
Please Log in to join the conversation.
- Daniel
- Offline
- Administrator
-
27 Sep 2017 12:36 #4891
by Daniel
Thanks
Daniel
Replied by Daniel on topic line chart with date on x axis
Hello,
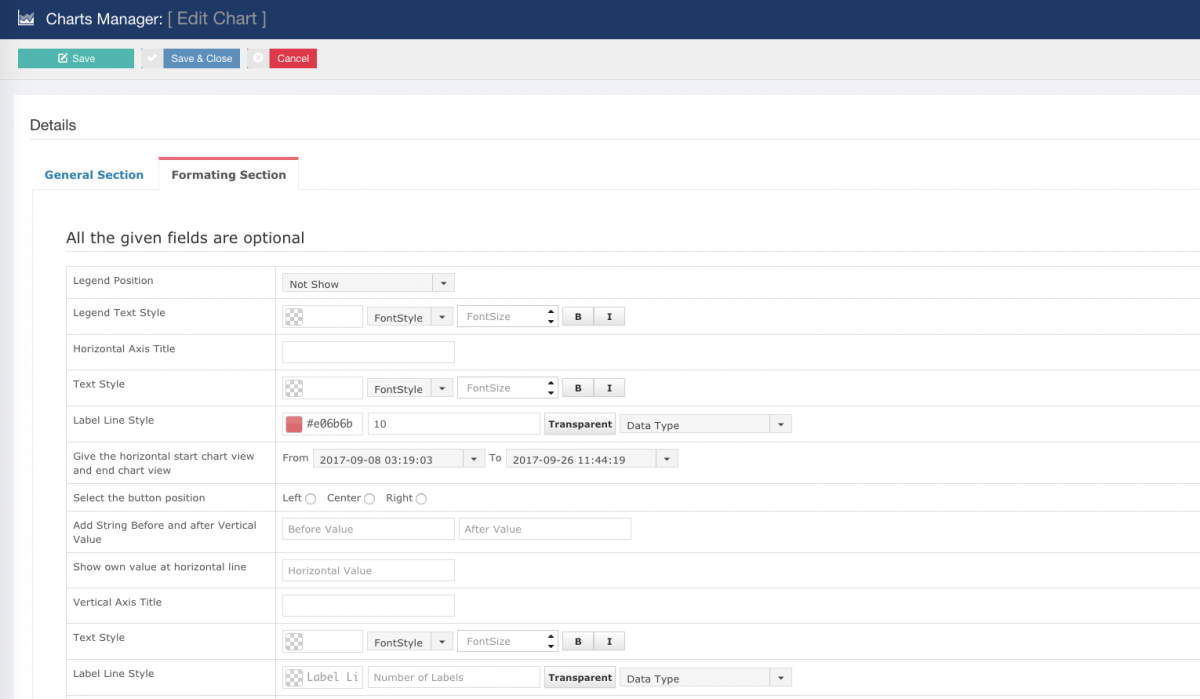
Do you see Label Line style option for Horizontal access in Formatting section? There is an option to select Data type. Please choose the required data type here as per your requirements. It would work fine. And for the database related issue, Please share your backend & FTP login credentials via Contact us form, We'll look into it.
Do you see Label Line style option for Horizontal access in Formatting section? There is an option to select Data type. Please choose the required data type here as per your requirements. It would work fine. And for the database related issue, Please share your backend & FTP login credentials via Contact us form, We'll look into it.
Thanks
Daniel
Please Log in to join the conversation.
- Peter Scal
- Topic Author
- Offline
- New Member
-
Less
More
- Posts: 2
26 Sep 2017 23:21 #4888
by Peter Scal
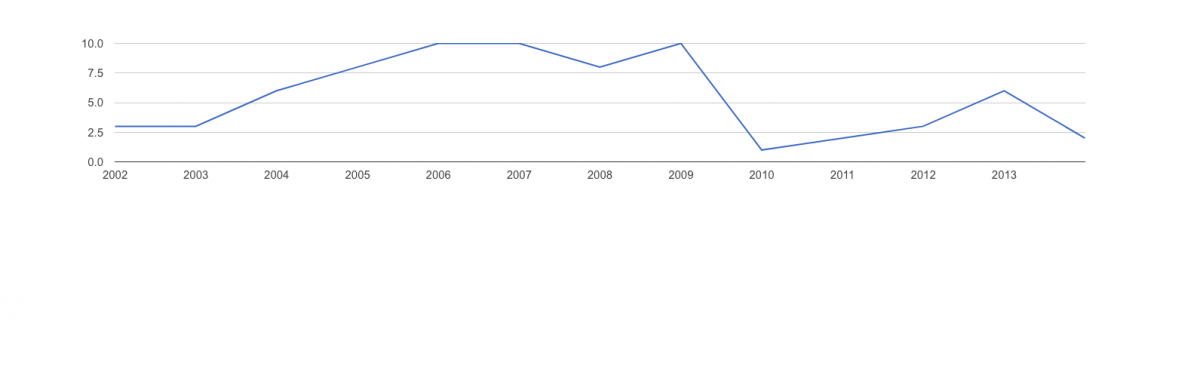
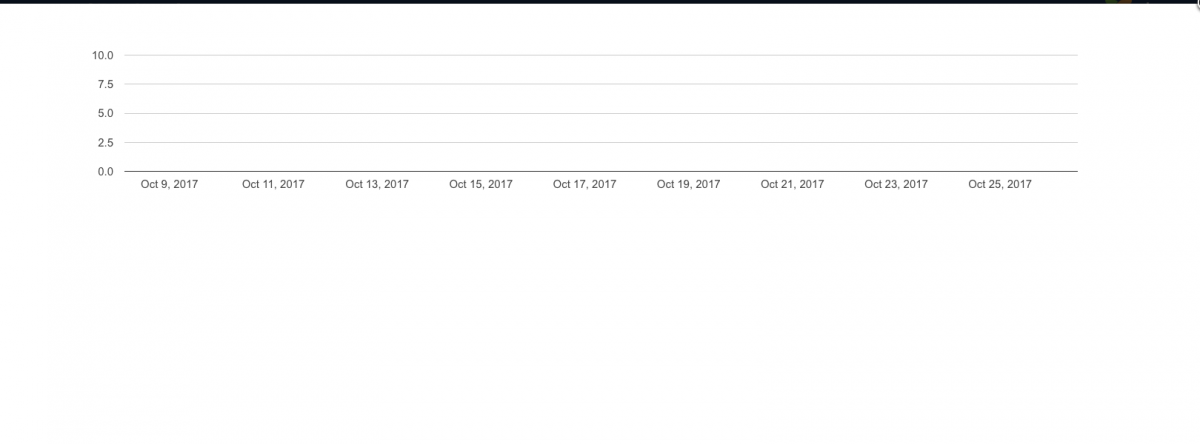
line chart with date on x axis was created by Peter Scal
Hello, I'm having a tough time getting started with vChart (read thru documentation twice). I tried to access data tables in Joomla created using Fabric, but couldn't get vChart to render the values from a column that had text labels attached to numeric elements ....so I downloaded the csv table and used it to create my chart. I was using a date/time element for the x axis but I can't get the formatting to fit in vChart (the mysql value is Y-m-d H:i:s) but don't see a similar format in vChart. I've attached screenshots of how this is setup in general and formatting section, and the resulting chart. if i use a different value for the x axis i get something close to what I"m looking for (see screenshot..)
can you help me get started here? thanks, Pbs

can you help me get started here? thanks, Pbs